2012 World Divorce Statistics Have Been Released


See the newest 2012 figure (updated January 2015) which now includes 70 countries.  

The United Nations released their annual World Demographics report that includes marriage and divorce rates for countries around the world.  As usual the numbers are incomplete as many countries do not report in time for this report, but the report also updates the 2011 data and these are more complete.

For the divorce rates, 36 countries have reported.  Among these countries, the highest rate is 4.1 divorces/population in Belarus which is the same as 2011.  The next highest is 3.6 in Lativa which is lower than for 2011.

This graph shows the divorce rates from highest to lowest in 2012 for all reporting countries in 2012 and another graph here for 2011.

Other charts and graphs of world divorce statistics.

Which ethnic group has the highest probability of getting divorce?


There are substantial differences in the likelihood of staying married depending on ethnic group membership.  In the chart below, there are estimates of the probability of women staying married by ethnic group.  Black women are the least likely to stay married for 20 years.  Only 37% Black are still in first marriages by 20 years.  About half of White and Hispanic women are still married at 20 years.  Asian women have the highest chance of staying married for 20 years.  (79%).

For men, Hispanic men are the most likely to stay married for 20 years (62%) and about half of Black (53%) and White (54%) men staying in intact first marriages for 20 years.

Probability that Marriage will remain intact for 20 years by ethnic group

The complete report on first marriages was produced by the National Center for Health Statistics.

Diverging Pathways of Marriage by Women’s Education


Cohabitation by Amount of Education 1995-2010


The most striking recent findings in regards to patterns of marriage is the variations in cohabitation by the educational level of women.  This chart comparing women with less than a high school degree with those women who earn a Bachelor degree is telling.  In 1995 46% of women with less than a high school degree started a first union as cohabitation.  In 2010 that percentage is now 70%.  For women with a Bachelor’s degree, cohabitation is more common, but only 47% of these women are starting their first union as cohabitation.  The more education that women have, the less likely they are to begin their first union as cohabitation.  The complete report on cohabitation trends is available from the National Center for Health Statistics.   

Are more well educated women less likely to get divorced?


Probabilty of marriage remaining intact by educational level for women                                                                                                                                                       
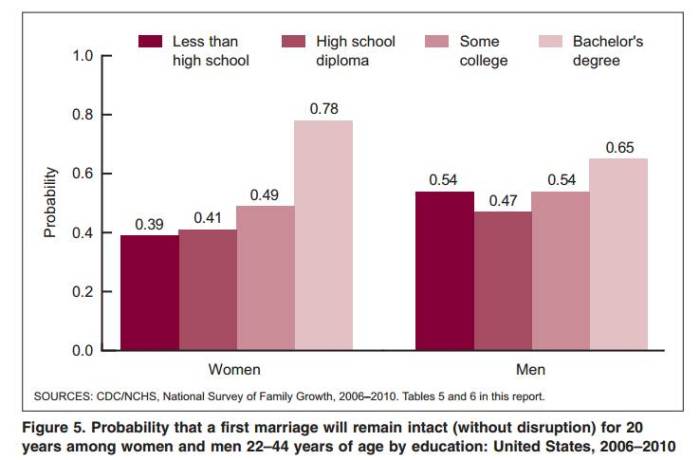
There is considerable evidence that suggests that women with more education are less likely to get divorced.  In this chart from the National Center for Health Statistics, you can see the percentages of women with various amounts of education and they likelihood that there marriages will last 20 years.  You can see that women with a college education are much more likely to have marriages that last over 20 years (about 80%).  There is a similar trend for men, but it is less dramatic.

A comprehensive report on trends in US marriage and divorce rates can be found at the National Center for Health Statistics.

What is happening to marriage in the US?


An easy way to get some insight into the state of marriage is to look at the trend in the time of first union (no union, cohabitation, or marriage) among women in the past 15 years.  The most telling part of this graph is the dramatic increase in the percentage of women beginning unions as cohabitation (34% in 1995 and up to 48% in 2010) and the decline in first unions that are marriages (39% in 1995 and only 23% in 2010).  The complete report on cohabitation was prepared by the National Center for Health Statistics.

Current Trends in Divorce Rates– US and the World


I just reviewed some of the latest demographic information about trends in terms of divorce rates in the US and around the world.  Here are links to these updated summaries. 

What is the current US Divorce Rate?


The divorce rate in 2011 (most current year when data are available) was 3.6 divorces per 1000 Americans.  In this graph the trend in the the US divorce rate over the past 10 years shows that the divorce rate has been declining over this ten year period.  Here are the original data.

US divorce rate 2001-2011


For a look at the trend in the US divorce rate over 100 years, see this graph. 

For more information about divorce rates ……