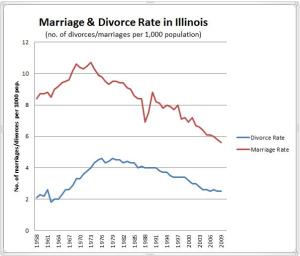
This figure shows the trends in marriage & divorce in Illinois from 1958-2011. On average in recent years (2000-2011) the rates of both marriage and divorce have leveled off, neither increasing or decreasing very much. Over the entire period of time, there are lower rates of marriage and divorce. Link to original data source.
marriage rate
2012 World Divorce Statistics Have Been Released
See the newest 2012 figure (updated January 2015) which now includes 70 countries.
The United Nations released their annual World Demographics report that includes marriage and divorce rates for countries around the world. As usual the numbers are incomplete as many countries do not report in time for this report, but the report also updates the 2011 data and these are more complete.
For the divorce rates, 36 countries have reported. Among these countries, the highest rate is 4.1 divorces/population in Belarus which is the same as 2011. The next highest is 3.6 in Lativa which is lower than for 2011.
This graph shows the divorce rates from highest to lowest in 2012 for all reporting countries in 2012 and another graph here for 2011.
What is happening to marriage in the US?
An easy way to get some insight into the state of marriage is to look at the trend in the time of first union (no union, cohabitation, or marriage) among women in the past 15 years. The most telling part of this graph is the dramatic increase in the percentage of women beginning unions as cohabitation (34% in 1995 and up to 48% in 2010) and the decline in first unions that are marriages (39% in 1995 and only 23% in 2010). The complete report on cohabitation was prepared by the National Center for Health Statistics.
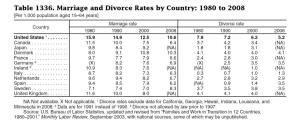
US Divorce Rates Compared to Western Countries
 Although the divorce rate has been declining in the United States, it is still higher than many of the other Western countries.
See original source at the U.S. Census Bureau.
More Demographic information here….
Illinois Marriage and Divorce Rates from 1958-2009

The divorce rate in Illinois rose from about 1958 to 1979, then began to fall. By 2009 the divorce was approaching the same rate as in the early 1960s.
The most dramatic change over the past 50 years is the decline in the rate of marriage. The highest rate of marriage was in 1973. The rate has steadily declined since then. The baby boom children were entering their late teens between 1965-1975. Clearly they were getting married at a high rate.
These numbers were based on reports produced by the Illinois Department of Public Health. The original report can be found here: