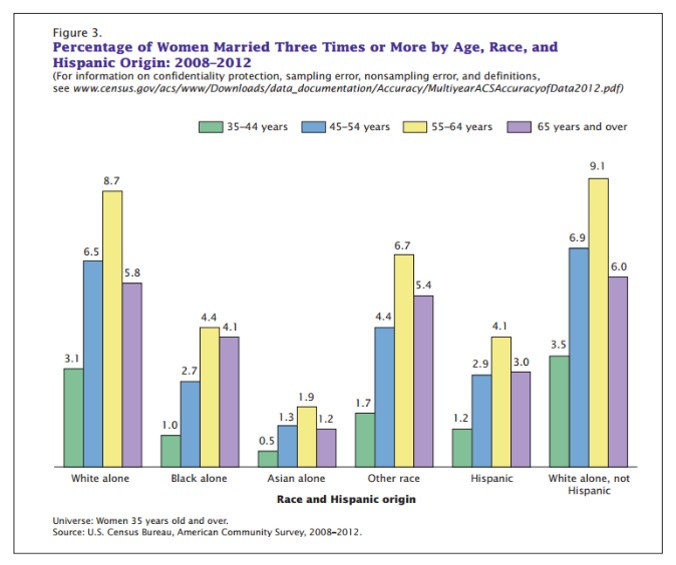
The U.S. Census Bureau published a recent report on remarriage. Here are a couple of graphs that illustrate some of the findings.

The U.S. Census Bureau published a recent report on remarriage. Here are a couple of graphs that illustrate some of the findings.

This figure comes from a recent report by the U S Census Bureau on marriage and divorce patterns in the United States. This particular graph shows the variation in the duration of first time marriages for women of different races and ethnic groups. Black-non-Hispanic women have the least chance of long marriages and Asian-non-Hispanic women have the best chance of a long marriage.