What is the age of first marriage in the US?


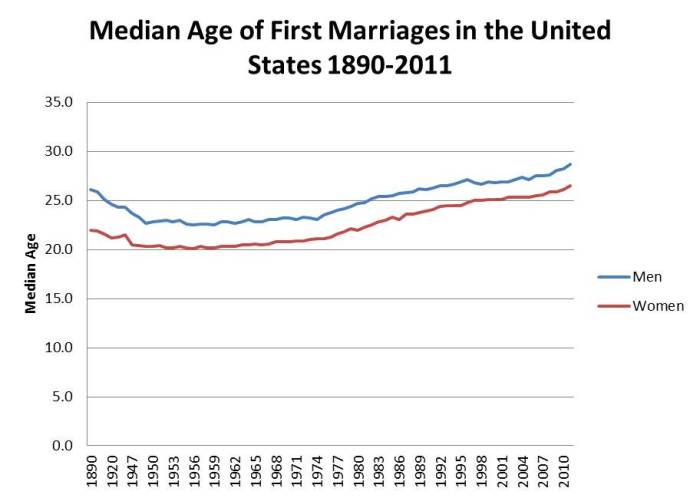
This figure shows the changes in the median age that men and women are when getting married for the first time in the United States from 1890 to 2011.  These data are based on a US Census Bureau table.

For men the age at first marriage declinced slightly from 1890 to 1949 when the age was 22. 7 years of age.  Then it rose slowly until about 1974 and then became to rise more rapidly until today when it is 28.7 years of age in 2011.  Note that cohabitation began to be more more in the 1970s and this may account for some of this change.
For women the age at first marriage declined between 1890 and 1947 when it was 20.3 years of age.  The age at first marriage for women did not change much at all from 1947-1962, then it began to increase until the present where it stands at 26.5 years of age.  This age may also be influenced by increased cohabitation among young people.
For more demographics on marriage and divorce….
Post-script on Iranian Women and Divorce


In a previous post I commented on a study that examined Iranian women’s reasons for seeking a divorce.  I found this comment in another research article exploring the high rates of suicide among some Iranian women.

“Contrary to Western countries where single elderly men often exhibit the highest rates of suicide, the highest rates in Iran are found among young married women. It appears that marriage serves as a stronger protective factor against suicide for men than for women. In fact, as suggested by our focus on fatalistic suicide among Iranian women, marriage actually seems to act as a risk factor for suicide among females.”

This is clearly a troubling comment and an important area of continued study.

U S Divorce Rates Over the Past 50 Years by Marriage Cohort


(Also, see a graph of the changes in the divorce rate for the past 100 years.)

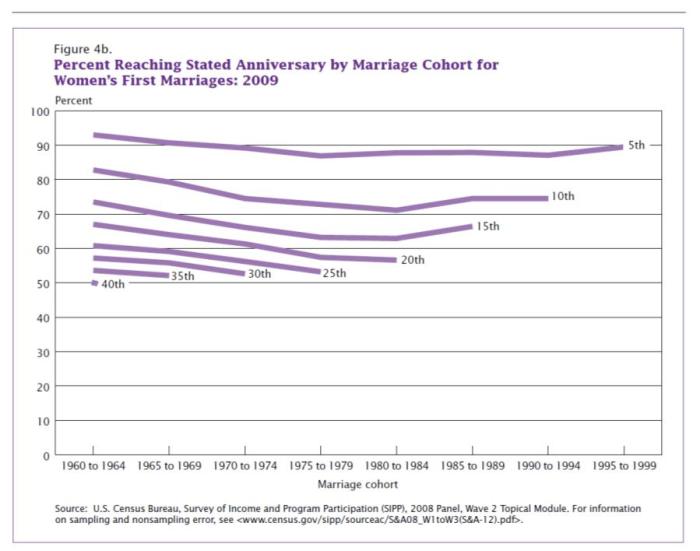
The best way to look at the divorce rates over time is to see how long marriages last by age cohorts (all the marriages that occur in a specific 5 year period).  This figure is part of a 2011 report by the U S Census Bureau on timing and duration of marriages. 

To understand this figure look at the percentage of marriages across cohorts that reach 5 years of marriage.  Over 90% of those married between 1960-64 had marriages that lasted at least 5 years.  This rate declined for most of the next cohorts and then by 1995-1999 the percentage making 5 years of marriage rose back to 90%.  You can see the best evidence of the declining divorce rate by looking at the shift in the pattern of marriages lasting 10 and 15 years.  Those marrying in the 1980s were more likely to have marriages lasting at least 10 and 15 years.  As we follow these couples over the next 20-30 years they are likely to continue to have longer marriages.

More divorce statistics are here….

Iranian Study of Women’s Reasons for Divorce


I am sure it is my Eurocentric view of the world and my inability to read any language other than English, but I really read or see research published on divorce and families in the Middle East or in Asia.

Through Google Scholar the following study conducted in Iran appeared in my inbox the other day.  There are some problems with the study, but it seems useful to imagine studying divorce in an Islamic country.  Although the study compares men and women’s reasons for divorce, the scientists were far less successful recruiting men (N = 30) than women (N= 270).  This makes comparing the two samples difficult even though this is the purpose of the paper.  None the less, the findings do provide insight into the reasons that women seek divorce in Iran.  Women give multiple reasons given are a “lack of understanding” and “lack of [meeting] psychological needs,” but over 50% mention family interventions, economic problems, slander, and psychological violence.   Physical violence and substance abuse are reported by about 40% of the women as the reason for requesting a divorce.

For more about Islamic and Iranian Divorce Law see this recent article…

How divorce rates vary by race and ethnicity in the U S


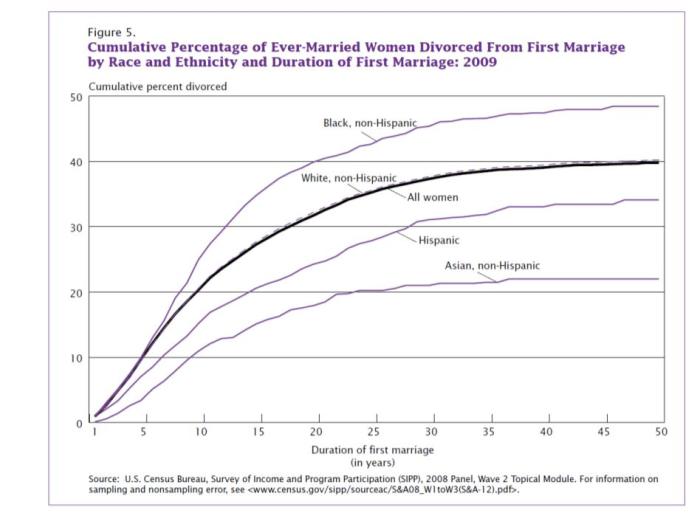
This figure comes from a recent report by the U S Census Bureau on marriage and divorce patterns in the United States.  This particular graph shows the variation in the duration of first time marriages for women of different races and ethnic groups.  Black-non-Hispanic women have the least chance of long marriages and Asian-non-Hispanic women have the best chance of a long marriage.

More divorce statistics are here….