Flowing Data has developed a very nice summary of divorce rates by occupation. Have not seen a better summary of this information.
Link: http://flowingdata.com/2017/07/25/divorce-and-occupation/
Flowing Data has developed a very nice summary of divorce rates by occupation. Have not seen a better summary of this information.
Link: http://flowingdata.com/2017/07/25/divorce-and-occupation/

 The age at which American men and women obtain their first divorce has been increasing since 1970 (because age at first marriage has also been increasing).
In 2015 the average age at first divorce for men is 41.2 years of age and is 39.7 years of age for women. 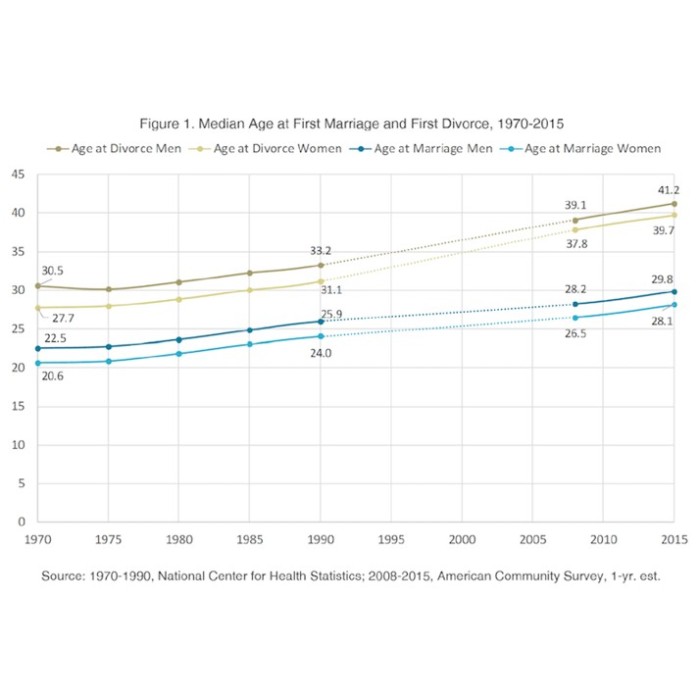
Divorce rates from countries across the world are collected by the United Nations. Although we are in 2016, divorce rate information for 2013 is just being completed. I have posted an easily readable graph of 71 countries reporting here. You can find the original source of this data at the UN Demographic Report. They have a little data for 2014.
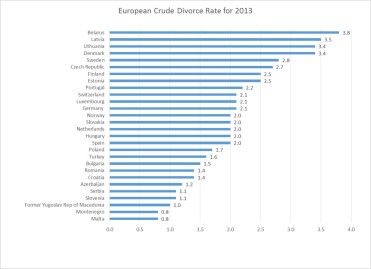
With only 27 countries reporting, the European divorce rates in 2013 indicate that the countries with the highest divorce rates are: Belarus, Latvia, Lithuania, & Denmark. Those with the lowest divorce rates are: Former Yugoslavia Republic of Macedonia, Montenegro and Malta.
See more world divorce trends.
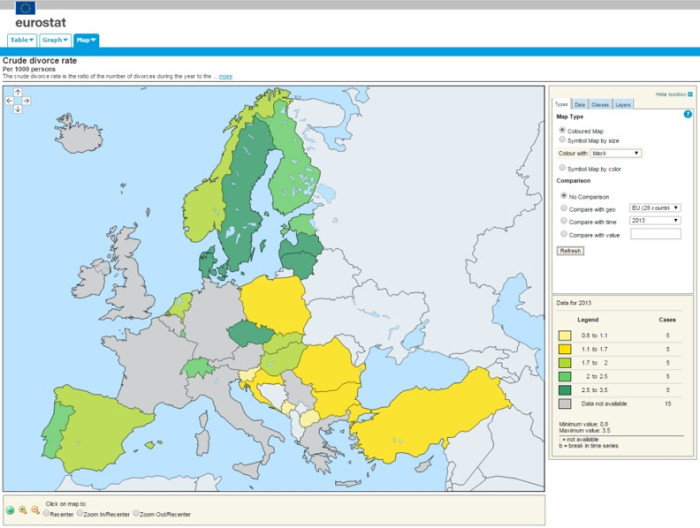
These data are from Eurostat.
Canadian divorce rates “Fluctuating between 35% and 42%, the proportion of marriages projected to end in divorce has remained relatively stable during the last 20 years. In 2008, 40.7% of marriages were projected to end in divorce before the thirtieth wedding anniversary.” More….
In 2011, the Census Bureau released a report that included the rates of divorce for each state in 2009. This report set off wild speculation about why some states have high or low divorce rates.
It is obvious that the soil, weather or average daily temperature have little to do with divorce rates, so what might lead to differential divorce rates among the states.
Here are some hypotheses and comparison of two states—Minnesota and Georgia.
First, what are the divorce rates for Minnesota and Georgia?
In 2009, the divorce rate for men in Minnesota is 7.4 per 1000 men and for women it is 7.8 per 1000 women. In Georgia the divorce rate is 11.5 per 1000 men and 11.7 per 1000 women. The divorce the United States for women was 9.7 divorces per 1000 women and 9.2 divorces per 1000 men. And the range of divorces for women was from the lowest in New Jersey of 6.0 divorces to 16.2 divorces in Alaska. For men the highest divorce rate was 13.5 in Arkansas and the lowest was 6.3 in the District of Columbia.
So what are some of the reasons why the divorce rate might be different in these two states? Table 1 provides the complete demographic comparison of both states.
The most obvious first idea is that there is a different rate in which people get married in each of these states. In other words, if you have fewer marriages you will get fewer divorces. So we should look to at the marriage rates in each state. In 2009, the marriage rate in Minnesota is 15.3 for men and 15.4 for women and the rate in Georgia is 22.1 for men and 20.4 for women. These numbers provide at least a clue about the differences in the divorce rate. At least in the past year, more people are getting married in Georgia than in Minnesota. Now one of the limitations of these numbers is that they are only the marriage rate in the past year, but if this difference has been generally consistent, then in Georgia there are just more married couples, therefore, more couples that can get divorced.
Young people in the age group of 25-34 are more likely to be getting married. Different states may have more or less people in this age group. In Minnesota, the percentage of the population in this age range is 13% and in Georgia it is 14%. Thus, it does not appear as if there are simply more young people of marriageable age that might increase the marriage and ultimately the divorce rate.
Another factor that might make a difference is the age of first marriage. We know from other data that couples that marry at a young age are more likely to divorce than couples who marry when they are older. Perhaps the age at first marriage is different between the two states.
In Minnesota, the age of first marriage for men is 27.8 years and for women is 26.3 years. In Georgia the age at first marriage for men is 27.7 years and the age for women is 25.9 years. These numbers are quite similar so this is not likely to explain the differences in the divorce rate.
Some of the factors that are consistently related to higher divorce rates are education and income. When the education and income levels are compared between the two states, Minnesota residents are in better shape. Although residents of Georgia have about the same percentage of residents with a Bachelor’s degree, there are more residents without a high school education (almost 30%) compared with Minnesota that only has 18% without a high school degree. Income also favors Minnesota. There are fewer residents with incomes under $25,000 and in poverty compared to Georgia.
There are also differences in the divorce rate among racial and ethnic groups. In a recent report, it was found that about 49% of Black marriages end in divorce compared to 41% of marriages of White marriages. When you compare the two states, Georgia has a Black population of 30% compared to Minnesota that has only 5% Black residents.
Both states have about the same percentage of urban residents.
There is some evidence that people who are more mobile are more likely to divorce. The suggestion is that these people are less attached to support systems and kin that may assist the couple. Both states have a high degree of stability, but Georgia has a slightly more mobile population.
In addition to marrying at a young age, having a child as a teenager or outside of marriage can increase a person’s risk of divorce. In both cases, Georgia has higher rates of teen births and births to unmarried women.
There is much debate about the role of religion in divorce. There is no reliable estimates of the divorce rate among various religious groups. The general perception of the south is that this is the “Bible Belt” referring to the historically large percentage of residents who are identified as conservative Christians. Somewhat surprisingly, a higher percentage of Minnesotans identify themselves as Christian compared to Georgians. We don’t have an estimate about whether these Christians are conservative or not.
In summary, the major differences between residents in the two states that may contribute to the differential divorce rate would seem to be the larger population of African-Americans, less education and lower incomes. Many of factors that might contribute to higher divorce rates are similar between the two states. It is important to understand the limits of this analysis; I conducted no statistical tests to compare the differences between the various demographic factors. These conclusions might not hold up to a more rigorous analysis.
Table 1. Summary of Demographic Characteristics of Residents of Minnesota and Georgia
|
Minnesota |
Georgia |
|||
| Factors |
Men |
Women |
Men |
Women |
| Divorce Rate |
7.4 |
7.8 |
11.5 |
11.7 |
| Marriage Rate |
15.3 |
15.4 |
22.1 |
20.4 |
| Age at First Marriage |
27.8 |
26.3 |
27.7 |
25.9 |
| Percentage of Population ages 25-34 |
13% |
14% |
||
| Education (BA or more) |
21.8% |
19.3% |
||
| Education (High School) |
82.4% |
70.9% |
||
| Urban |
70.9% |
71.6% |
||
| Mobility (same house 2007-2008) |
85.9% |
82.6% |
||
| Religious Affiliation (Christian) |
60.5% |
43.1% |
||
| Ethnicity | ||||
| White |
89% |
65% |
||
| Black |
5% |
30% |
||
| Births to Teens |
7.1 |
12.2 |
||
| Births to Unmarried Women |
32.7 |
43.6 |
||
| Household Income under $25,000 |
21% |
27% |
||
| Households below poverty |
7% |
12.7% |
||
Data Sources:
All of the statistics in this report are based on data U.S. Census Bureau, Statistical Abstract of the United States: 2012 as follows:
Population Data:
Births, Deaths, Marriages & Divorces
Income, Expenditures, Poverty and Wealth
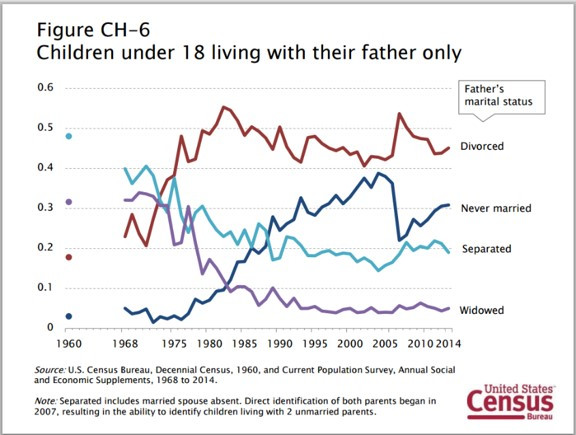
More children are living with their divorced or never married dads in the last 40 years, but look at what happened during the recession– more divorced dads with children and a dramatic drop for unmarried fathers. The employment status of unmarried fathers may have something to do with this change. More US Census Bureau demographics about living arrangements of children.
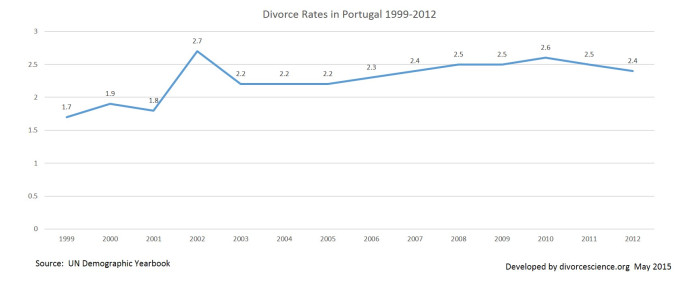
After a spike in the divorce rate in 2002, the divorce rate in Portugal has only slightly increased over the past decade. In 2008, “no-fault divorce” was legalized which may account for the slight increase in divorce since 2003.
A more complete list of research report about divorce, remarriage and stepfamilies published in 2015 or between 2010-2015.
The best source for the latest information about marriage and divorce trends in European countries is Eurostat….. included in their site is a tool for creating graphs of the information. See this example.
