The best source for the latest information about marriage and divorce trends in European countries is Eurostat….. included in their site is a tool for creating graphs of the information. See this example.
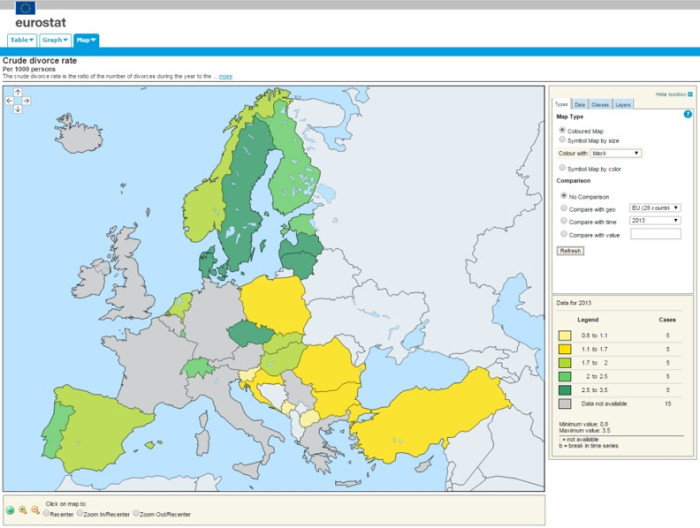
The best source for the latest information about marriage and divorce trends in European countries is Eurostat….. included in their site is a tool for creating graphs of the information. See this example.
Over time this figure shows the changes in marital history of men in different birth cohorts (a birth cohort is all the men born in a specific time period). The men born in the years 1940-44 were ages 77-82 when this report was created. The men born in the years 1975-79 were ages 32-37. Keep this in mind when looking at these data. The younger group (1975-79) is still likely to experience more changes in their marital history.
Nevertheless, you can still see some trends. On average, about 2/3 of men are married at least once and this has remained constant over much of this period except this most recent period (those born 1975-79 who still have a chance of marriage). A more difficult trend to determine in whether 2nd and 3rd time marriages are declining– the cohorts between 1950-1969 seem to suggest this trend. The increase in the number of men never getting married is also apparent, but there is also a trend of marrying at older ages so some of the men born between 1970-1979 may still get married. 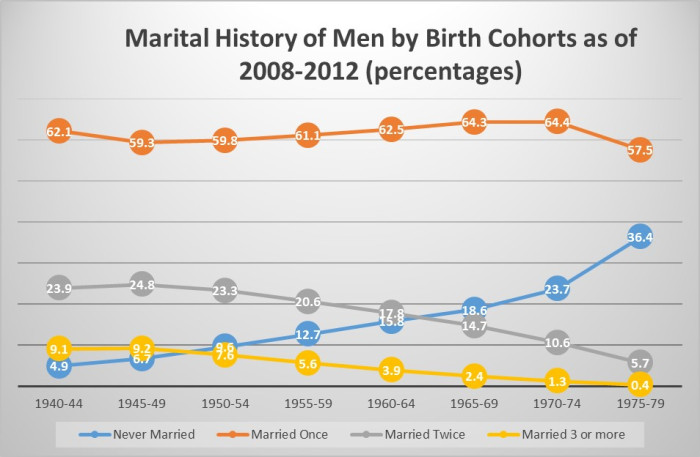
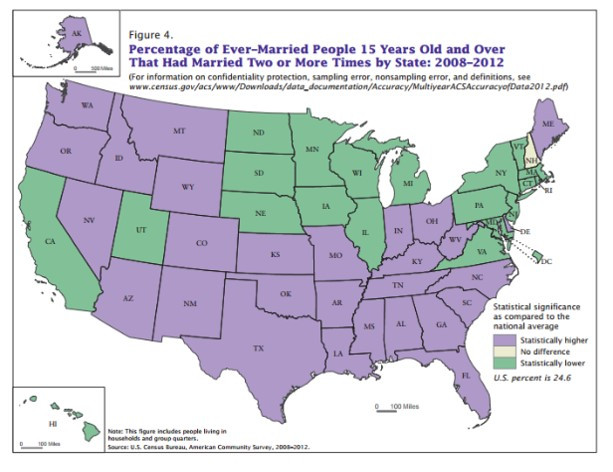
The U.S. Census Bureau published a recent report on remarriage. Here are a couple of graphs that illustrate some of the findings. In the graph below you can see which states have a higher than average remarriage rate ( Purple) and which states have a lower rate (Green). Interesting to speculate as to why the Midwest and Northeast has a lower rate. May be due to age of the population. Note that about 25% of all adults (older than 15) are remarried.
A good description of the changes in American families from 1910- 1990.
For example, see this figure for how fertility has changed over the 20th century. The number of children per family declines until after WWII, then increases dramatically until it reaches 3.7 children per woman (family) in the late 1950s, (higher than in the 1920s), then declines again in the earlier 1970s to less than 2 children per woman (family).
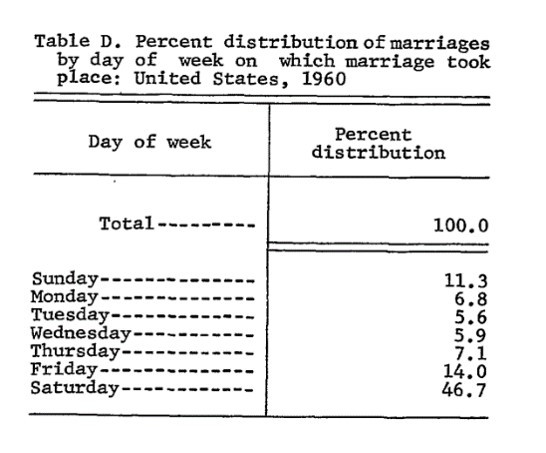
This document summarizes the long-term trends in marriage and divorce in the Untied States between 1867-1967. Much of this can be found elsewhere, but there are some fun bits of historical trivia that show how marriage and divorce have changed and not changed over this historical period. Here are a couple of sample tables. 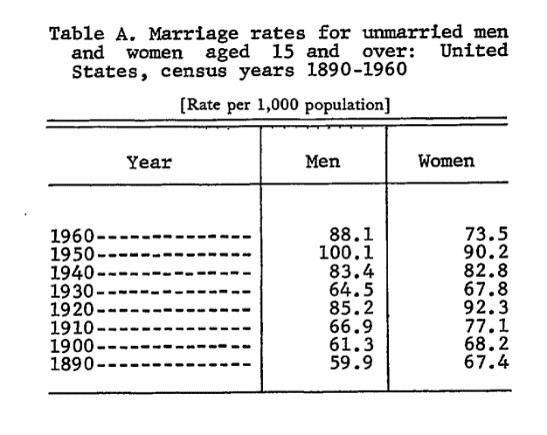
This figure shows the trends in marriage & divorce in Illinois from 1958-2011. On average in recent years (2000-2011) the rates of both marriage and divorce have leveled off, neither increasing or decreasing very much. Over the entire period of time, there are lower rates of marriage and divorce. Link to original data source.
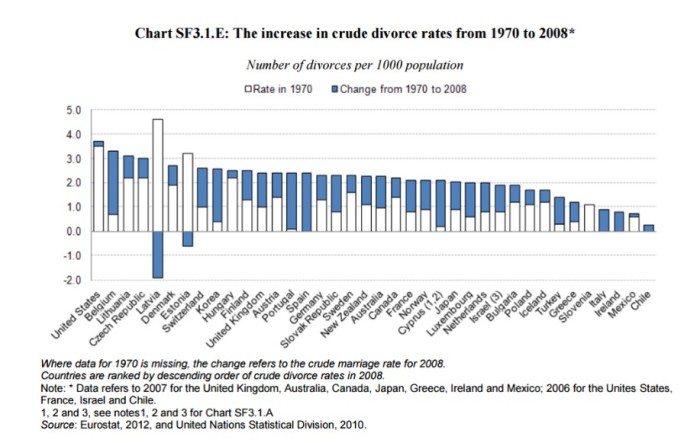
Eurostat periodically issues some nice charts and explanations of marriage and divorce trends in the OECD countries. Here is a sample of their work. Complete report on these trends. The report states,
“The crude divorce rates and their changes from 1970 to 2008 are presented in Chart SF3.1.E. During this period, divorce rates increased in most countries, except for Estonia and Latvia where divorce rates were high in 1970 (the increase in divorce rates in the United States from a similar base was also very small). There were large cross-national differences in crude divorce rates in 2008, and ranged from a low of less than one divorce per 1000 inhabitants in Chile and Mexico, to over 3 per 1000 inhabitants in Belgium and the United States.”