Remarriage Reality– What percentage of Americans have been married 3 times?


If you used celebrities as your guide to marriage and divorce, you would think that everyone is constantly marrying, divorcing and remarrying again.  So what is the reality.

In 2009, the Census Bureau reported that among all current marriages, here were the percentages of husbands and wives and their marital histories. [See Table 10, page 19 for more details.]

  • Husband, 1st marriage, Wife, 1st marriage       71.5%
  • Wife, 1st marriage, Husband, 2nd marriage       7.8%
  • Wife, 2nd marriage, Husband, 2nd marriage     7.5%
  • Wife, 2nd marriage, Husband, 1st marriage       6.3%
  • Wife, 2nd marriage, Husband, 3rd marriage      2.0%
  • Wife 3rd marriage, Husband, 2nd marriage       1.7%
  • Wife 1st marriage, Husband, 3rd marriage        1.2%
  • Wife 3rd marriage, Husband, 3rd marriage       1.2%
  • Wife 3rd marriage, Husband 1st marriage         0.9%

The results show that most Americans who are married are in their first marriage for both husbands and wives.  Only 7% of all marriages include one spouse who has been married 3 times.

U S Divorce Rates Over the Past 50 Years by Marriage Cohort


(Also, see a graph of the changes in the divorce rate for the past 100 years.)

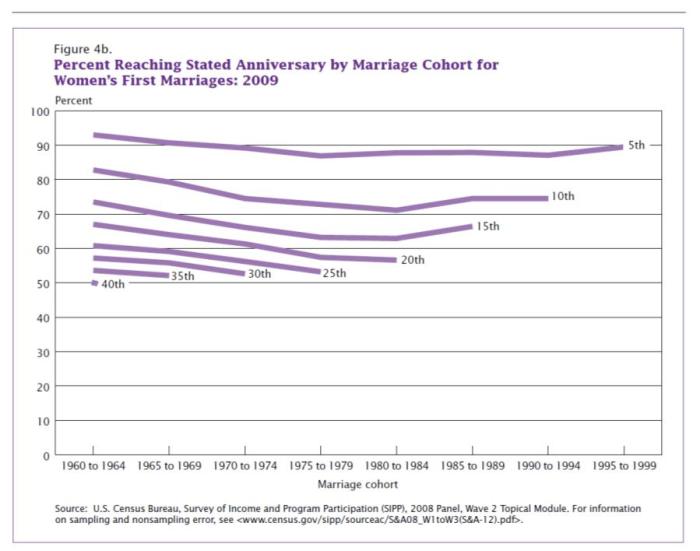
The best way to look at the divorce rates over time is to see how long marriages last by age cohorts (all the marriages that occur in a specific 5 year period).  This figure is part of a 2011 report by the U S Census Bureau on timing and duration of marriages. 

To understand this figure look at the percentage of marriages across cohorts that reach 5 years of marriage.  Over 90% of those married between 1960-64 had marriages that lasted at least 5 years.  This rate declined for most of the next cohorts and then by 1995-1999 the percentage making 5 years of marriage rose back to 90%.  You can see the best evidence of the declining divorce rate by looking at the shift in the pattern of marriages lasting 10 and 15 years.  Those marrying in the 1980s were more likely to have marriages lasting at least 10 and 15 years.  As we follow these couples over the next 20-30 years they are likely to continue to have longer marriages.

More divorce statistics are here….

How divorce rates vary by race and ethnicity in the U S


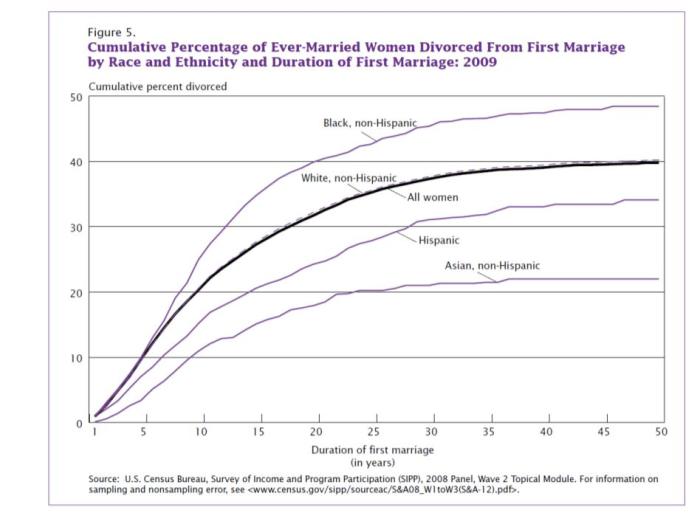
This figure comes from a recent report by the U S Census Bureau on marriage and divorce patterns in the United States.  This particular graph shows the variation in the duration of first time marriages for women of different races and ethnic groups.  Black-non-Hispanic women have the least chance of long marriages and Asian-non-Hispanic women have the best chance of a long marriage.

More divorce statistics are here….

Percentage of Married Men Who Divorce


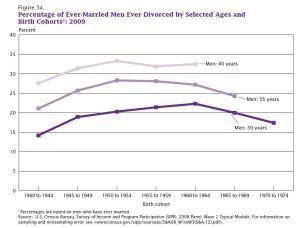
This figure that is taken from a Census Bureau report that summarizes marriage and divorce patterns in the US illustrates what has been happening over time with the divorce rate.  In this figure you see that the percentage of men who are 30 years old who are divorced has been going down.  Those born between 1960-64 had the highest percentage of divorce and all those born after this time have had a lower rate of divorce.  Those men who were in 1970-1974 are approaching the same rates of divorce as men born in the 1940s.    The pattern is similar for men at ages 35.  We don’t have the data for the men at 40, but the pattern is likely to be the same.