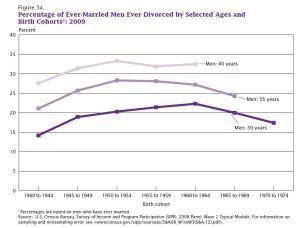
This figure that is taken from a Census Bureau report that summarizes marriage and divorce patterns in the US illustrates what has been happening over time with the divorce rate. In this figure you see that the percentage of men who are 30 years old who are divorced has been going down. Those born between 1960-64 had the highest percentage of divorce and all those born after this time have had a lower rate of divorce. Those men who were in 1970-1974 are approaching the same rates of divorce as men born in the 1940s. The pattern is similar for men at ages 35. We don’t have the data for the men at 40, but the pattern is likely to be the same.