75 Years of Change in American Families– 1910 – 1990


A good description of the changes in American families from 1910- 1990.

For example, see this figure for how fertility has changed over the 20th century.  The number of children per family declines until after WWII, then increases dramatically until it reaches 3.7 children per woman (family) in the late 1950s, (higher than in the 1920s), then declines again in the earlier 1970s to less than 2 children per woman (family).
Historical Marriage & Divorce Data for the United States 1867-1967


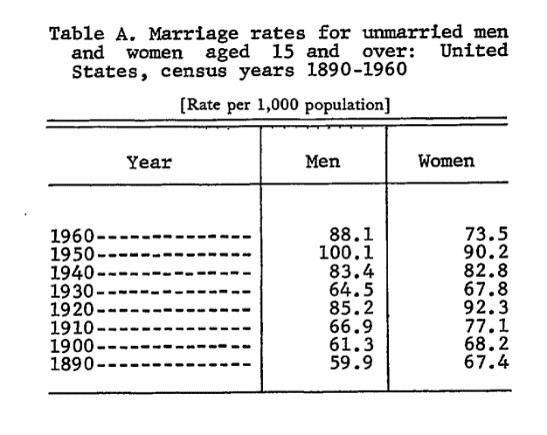
This document summarizes the long-term trends in marriage and divorce in the Untied States between 1867-1967.  Much of this can be found elsewhere, but there are some fun bits of historical trivia that show how marriage and divorce have changed and not changed over this historical period.  Here are a couple of sample tables.  Marriage Rates in US for 20th century

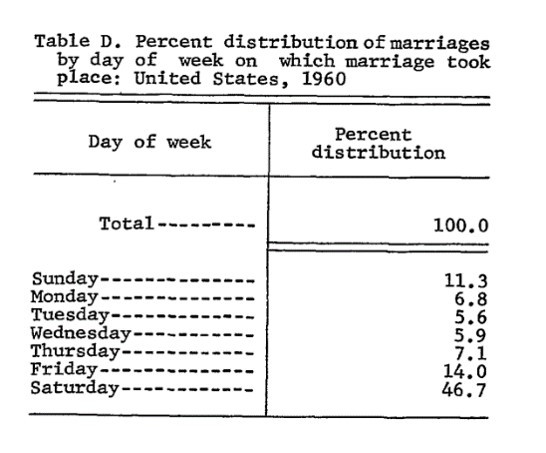
Wedding day of the week US 1960