Marital History of U.S. Men from 1940-2012


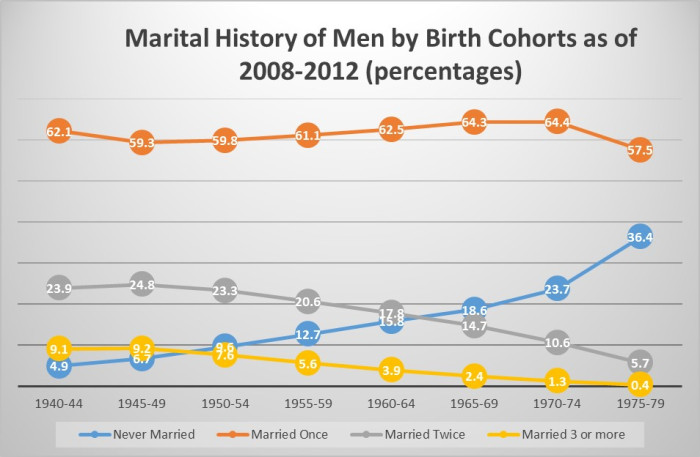
Over time this figure shows the changes in marital history of men in different birth cohorts (a birth cohort is all the men born in a specific time period).  The men born in the years 1940-44 were ages 77-82 when this report was created.  The men born in the years 1975-79 were ages 32-37.  Keep this in mind when looking at these data.  The younger group (1975-79) is still likely to experience more changes in their marital history.

Nevertheless, you can still see some trends.  On average, about 2/3 of men are married at least once and this has remained constant over much of this period except this most recent period (those born 1975-79 who still have a chance of marriage).  A more difficult trend to determine in whether 2nd and 3rd time marriages are declining– the cohorts between 1950-1969 seem to suggest this trend.  The increase in the number of men never getting married is also apparent, but there is also a trend of marrying at older ages so some of the men born between 1970-1979 may still get married.  Marital History of Men By birth cohorts 2008-2012

What is the age of first marriage in the US?


This figure shows the changes in the median age that men and women are when getting married for the first time in the United States from 1890 to 2011.  These data are based on a US Census Bureau table.

For men the age at first marriage declinced slightly from 1890 to 1949 when the age was 22. 7 years of age.  Then it rose slowly until about 1974 and then became to rise more rapidly until today when it is 28.7 years of age in 2011.  Note that cohabitation began to be more more in the 1970s and this may account for some of this change.
For women the age at first marriage declined between 1890 and 1947 when it was 20.3 years of age.  The age at first marriage for women did not change much at all from 1947-1962, then it began to increase until the present where it stands at 26.5 years of age.  This age may also be influenced by increased cohabitation among young people.
For more demographics on marriage and divorce….

Percentage of Married Men Who Divorce


This figure that is taken from a Census Bureau report that summarizes marriage and divorce patterns in the US illustrates what has been happening over time with the divorce rate.  In this figure you see that the percentage of men who are 30 years old who are divorced has been going down.  Those born between 1960-64 had the highest percentage of divorce and all those born after this time have had a lower rate of divorce.  Those men who were in 1970-1974 are approaching the same rates of divorce as men born in the 1940s.    The pattern is similar for men at ages 35.  We don’t have the data for the men at 40, but the pattern is likely to be the same.