Marital History of U.S. Men from 1940-2012


Over time this figure shows the changes in marital history of men in different birth cohorts (a birth cohort is all the men born in a specific time period).  The men born in the years 1940-44 were ages 77-82 when this report was created.  The men born in the years 1975-79 were ages 32-37.  Keep this in mind when looking at these data.  The younger group (1975-79) is still likely to experience more changes in their marital history.

Nevertheless, you can still see some trends.  On average, about 2/3 of men are married at least once and this has remained constant over much of this period except this most recent period (those born 1975-79 who still have a chance of marriage).  A more difficult trend to determine in whether 2nd and 3rd time marriages are declining– the cohorts between 1950-1969 seem to suggest this trend.  The increase in the number of men never getting married is also apparent, but there is also a trend of marrying at older ages so some of the men born between 1970-1979 may still get married.  Marital History of Men By birth cohorts 2008-2012

Child Support Enforcement in the United States


The US federal government collects much data about child support and its enforcement.  Over the past 50 years there have been many changes in the enforcement process.  (See history 1950-2012 and 2013 update.).

In addition to this description you can see the changes in the demographics of the participants over time.  Below is a summary of this 2013 report.

The national Census Bureau data show that in 2011, 14.4 million parents had custody of children under age 21 while the other parent lived elsewhere, and the aggregate amount of child support received was $23.6 billion. In 2011, 82% of custodial parents were mothers. Of all custodial parents, 50% were white, 25% were black, 21% were Hispanic, 18% were married, 33% were divorced, 35% were never married, 15% did not have a high school diploma, 17% had at least a bachelor’s degree, 50% worked full-time year-round, 29% had family income below poverty, and 39% received some type of public assistance. In 2011, only 2.7 million (38%) of the nearly 7.1 million custodial parents with child support orders actually received the full amount of child support that was owed to them. The average yearly child support payment received by custodial parents with payments was $5,160 for mothers and $4,433 for fathers. These full or partial payments represented 17% of the custodial mothers’ total yearly income and 11% of the custodial fathers’. Compared to 1993 Census data, less child support was received by custodial parents in 2011 ($23.9 billion in 1993 versus $23.6 billion in 2011; in 2011 dollars). However, a higher percentage of those owed child support actually received all that they were due (36.9% in 1993 versus 43.4% in 2011).

Historical Marriage & Divorce Data for the United States 1867-1967


This document summarizes the long-term trends in marriage and divorce in the Untied States between 1867-1967.  Much of this can be found elsewhere, but there are some fun bits of historical trivia that show how marriage and divorce have changed and not changed over this historical period.  Here are a couple of sample tables.  Marriage Rates in US for 20th century

Wedding day of the week US 1960

2011 Updated World Divorce Rates — 82 countries reporting


In January 2015, I updated the 2011 World Divorce Rate data and created this figure to illustrate the overall divorce rates.  This represents the most current data across the world that is consistently reported to the United Nations.  Many countries that have not yet reported 2012 or 2013 data such as the United States and Great Britain are included in this figure.  Also, there are 70 countries that have reported their 2012 divorce rates and 11 countries that have reported 2013 data.  The original data can be found in the United Nations Demographic Yearbook.  

2011 updated world divorce rates

New US Census Data on Divorce?


In the last 2-3 days I have seen several mentions in the “business press” about new 2012 US Census data on  the number of divorces increasing.  For example, here is the sentence from Bloomberg….Worsening divorce rate….  After doing some looking in the US Census data and American Community Survey…. I can’t find this data.  Anyone know where it is?

This figure provides the most current trend in US divorce rate in the last 10 years that I can find and here is the trend in US divorce rates over the past 100 years. 

Diverging Pathways of Marriage by Women’s Education


Cohabitation by Amount of Education 1995-2010


The most striking recent findings in regards to patterns of marriage is the variations in cohabitation by the educational level of women.  This chart comparing women with less than a high school degree with those women who earn a Bachelor degree is telling.  In 1995 46% of women with less than a high school degree started a first union as cohabitation.  In 2010 that percentage is now 70%.  For women with a Bachelor’s degree, cohabitation is more common, but only 47% of these women are starting their first union as cohabitation.  The more education that women have, the less likely they are to begin their first union as cohabitation.  The complete report on cohabitation trends is available from the National Center for Health Statistics.   

Are more well educated women less likely to get divorced?


Probabilty of marriage remaining intact by educational level for women                                                                                                                                                       
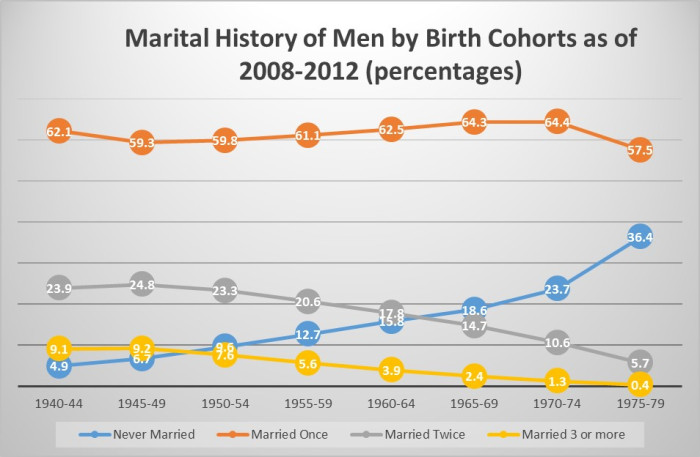
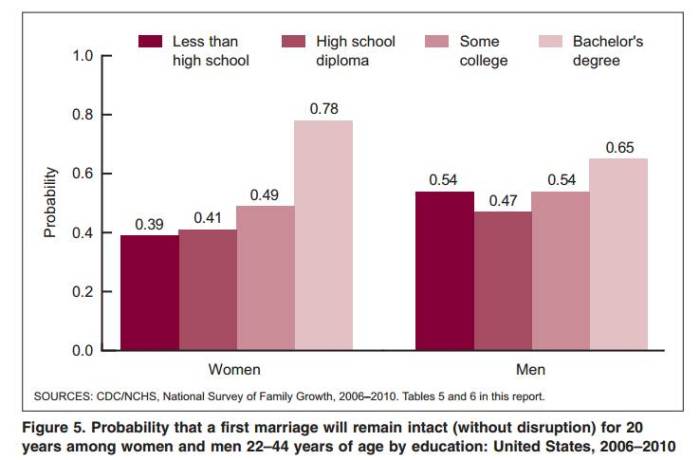
There is considerable evidence that suggests that women with more education are less likely to get divorced.  In this chart from the National Center for Health Statistics, you can see the percentages of women with various amounts of education and they likelihood that there marriages will last 20 years.  You can see that women with a college education are much more likely to have marriages that last over 20 years (about 80%).  There is a similar trend for men, but it is less dramatic.

A comprehensive report on trends in US marriage and divorce rates can be found at the National Center for Health Statistics.