Trend in Children under 18 Living with Single Fathers


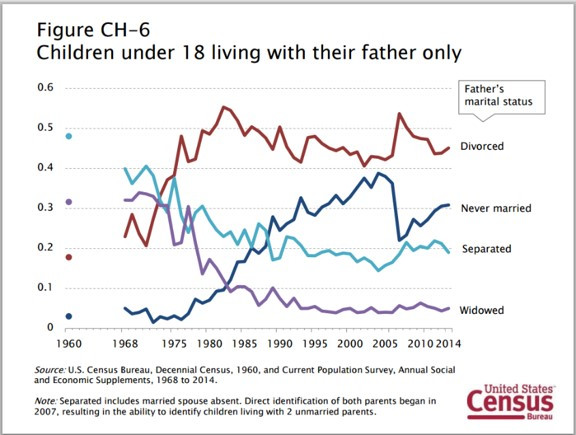
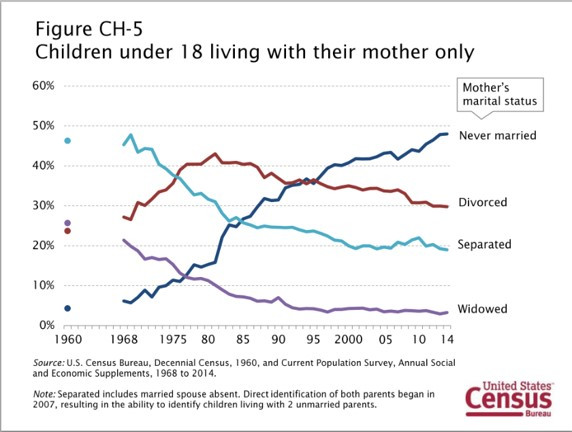
More children are living with their divorced or never married dads in the last 40 years, but look at what happened during the recession– more divorced dads with children and a dramatic drop for unmarried fathers.  The employment status of unmarried fathers may have something to do with this change.  More US Census Bureau demographics about living arrangements of children.

Children under 18 living with single father


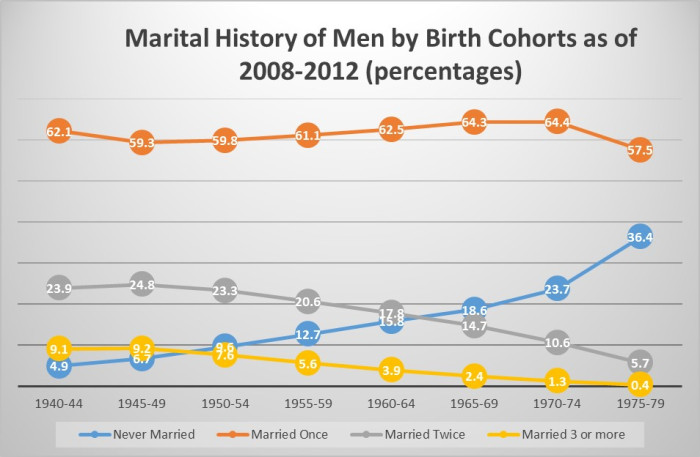
Marital History of U.S. Men from 1940-2012


Over time this figure shows the changes in marital history of men in different birth cohorts (a birth cohort is all the men born in a specific time period).  The men born in the years 1940-44 were ages 77-82 when this report was created.  The men born in the years 1975-79 were ages 32-37.  Keep this in mind when looking at these data.  The younger group (1975-79) is still likely to experience more changes in their marital history.

Nevertheless, you can still see some trends.  On average, about 2/3 of men are married at least once and this has remained constant over much of this period except this most recent period (those born 1975-79 who still have a chance of marriage).  A more difficult trend to determine in whether 2nd and 3rd time marriages are declining– the cohorts between 1950-1969 seem to suggest this trend.  The increase in the number of men never getting married is also apparent, but there is also a trend of marrying at older ages so some of the men born between 1970-1979 may still get married.  Marital History of Men By birth cohorts 2008-2012
Divorce Rate Trends in OECD Countries 1970-2008


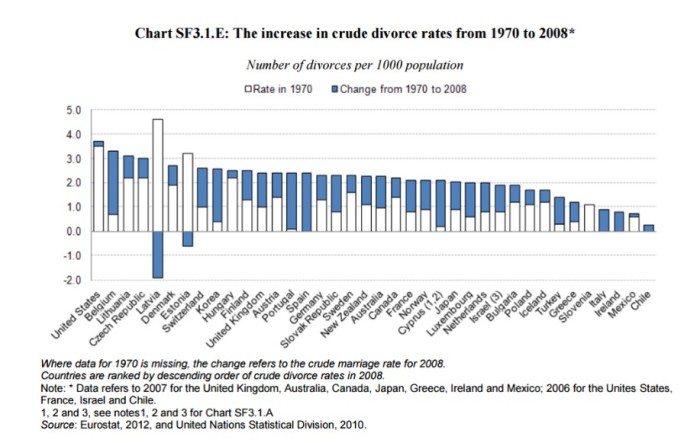
Eurostat periodically issues some nice charts and explanations of marriage and divorce trends in the OECD countries.  Here is a sample of their work.  Complete report on these trends.    The report states,

“The crude divorce rates and their changes from 1970 to 2008 are presented in Chart SF3.1.E. During this period, divorce rates increased in most countries, except for Estonia and Latvia where divorce rates were high in 1970 (the increase in divorce rates in the United States from a similar base was also very small). There were large cross-national differences in crude divorce rates in 2008, and ranged from a low of less than one divorce per 1000 inhabitants in Chile and Mexico, to over 3 per 1000 inhabitants in Belgium and the United States.”

OECD divorce rates change 1970-2008

Child Trends Data Related to Marriage and Parenting


Child Trends collects and organizes lots of data about children and families.  Below are some the indicators that apply to marriage and parenting.

  • Attitudes Towards Spanking   (Attitudes Towards Spanking– Figure)
  • Births to Unmarried Women (Births to Unmarried Women– Figure)
  • Child Support Payments  (Child Support Payments –Figure)
  • Dating    (Dating–Figure)
  • Dating Violence    (Dating Violence–Figure)
  • Living Arrangements for Children– Single parents    (Living Arrangements of Children–Figure)
  • Fertility & Birth Rates    (Fertility and Birth Rates–Figure)
  • Heavy Drinking Among Parents  (Heavy Drinking Among Parents–Figure)
  • Parental Depression  (Parental Depression– Figure)
  • Parental Education   (Parental Education –Figure )
  • Parental Expectations about Academic Achievement  (Parental Expectations about Academic Achievement– Figure)
  • Religious Service Attendance by Children   (Religious Service Attendance by Children– Figure)
  • Secure Parental Employment  (Secure Parental Employment– Figure)
  • Sexually Experienced Teens   (Sexually Experienced Teens– Figure)
  • Teen Births   (Teen Births– Figure)
  • Teen Pregnancy   (Teen Pregnancy– Figure)
  • Unintended Births    (Unintended Births– Figure)
  • Young Adults in Jail or Prison   (Young Adults in Jail or Prison– Figure)

Divorce Rates in England and Wales 1971-2011


The divorce rate in England and Wales has edged up slightly in 2011 compared to 2010.  (See complete report.)  For 2011, the rate was 10.8 divorces per 1,000 married persons.  The rates were identical for men and women.  Over the 40 year time frame (1971-2011), the divorce rates have been falling since 2005.  The rates are about the same as the early 1980s.  Some caution must be observed in understanding these rates as cohabitation has been increasing during the time period and the rate of marriage has been declining.

The United Kingdom Office of National Statistics just released the 2011 report on cohabitation and divorce.  As a part of this report they have produced some excellent 5 minute explanatory videos examining the patterns of cohabitation and civil partnerships.

They produce some very comprehensive statistics and marriage, cohabitation, civil partnerships and divorce. 

More information on divorcescience related to demographics….