An easy way to get some insight into the state of marriage is to look at the trend in the time of first union (no union, cohabitation, or marriage) among women in the past 15 years. The most telling part of this graph is the dramatic increase in the percentage of women beginning unions as cohabitation (34% in 1995 and up to 48% in 2010) and the decline in first unions that are marriages (39% in 1995 and only 23% in 2010). The complete report on cohabitation was prepared by the National Center for Health Statistics.
United States
Current Trends in Divorce Rates– US and the World
I just reviewed some of the latest demographic information about trends in terms of divorce rates in the US and around the world. Here are links to these updated summaries.
- The US divorce rate has been declining for the past 10 years.
- The country with the highest divorce rate in the world is Russia at about 5.0 divorce per 1000 population.
- The best estimates of the divorce rates for each country can be found at the United Nations. This table summarizes the available divorce rates in 2011.
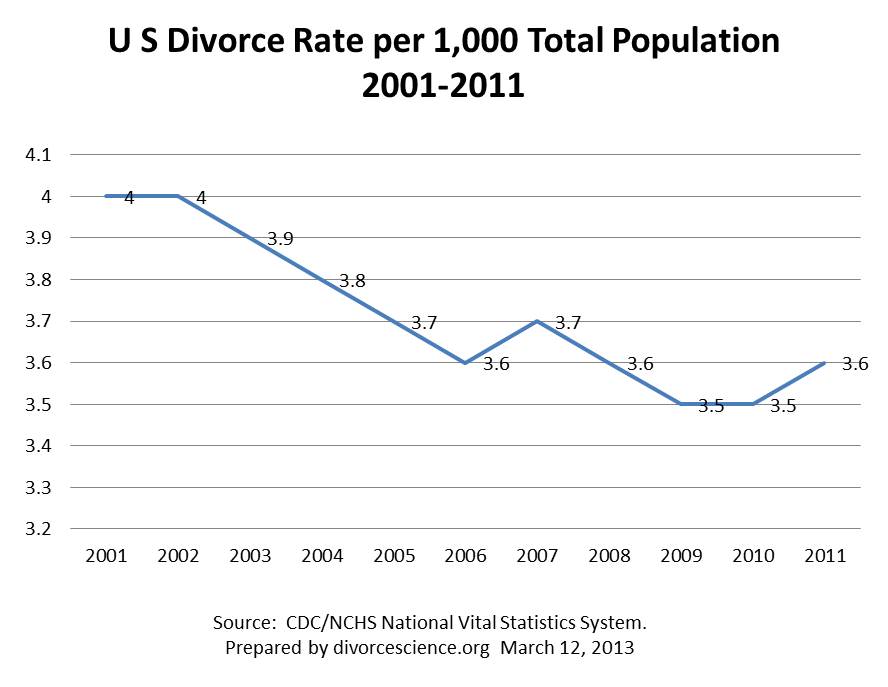
What is the current US Divorce Rate?
The divorce rate in 2011 (most current year when data are available) was 3.6 divorces per 1000 Americans. In this graph the trend in the the US divorce rate over the past 10 years shows that the divorce rate has been declining over this ten year period. Here are the original data.
For a look at the trend in the US divorce rate over 100 years, see this graph.
U S Divorce Rates Over the Past 50 Years by Marriage Cohort

(Also, see a graph of the changes in the divorce rate for the past 100 years.)
The best way to look at the divorce rates over time is to see how long marriages last by age cohorts (all the marriages that occur in a specific 5 year period). This figure is part of a 2011 report by the U S Census Bureau on timing and duration of marriages.
To understand this figure look at the percentage of marriages across cohorts that reach 5 years of marriage. Over 90% of those married between 1960-64 had marriages that lasted at least 5 years. This rate declined for most of the next cohorts and then by 1995-1999 the percentage making 5 years of marriage rose back to 90%. You can see the best evidence of the declining divorce rate by looking at the shift in the pattern of marriages lasting 10 and 15 years. Those marrying in the 1980s were more likely to have marriages lasting at least 10 and 15 years. As we follow these couples over the next 20-30 years they are likely to continue to have longer marriages.
How divorce rates vary by race and ethnicity in the U S

This figure comes from a recent report by the U S Census Bureau on marriage and divorce patterns in the United States. This particular graph shows the variation in the duration of first time marriages for women of different races and ethnic groups. Black-non-Hispanic women have the least chance of long marriages and Asian-non-Hispanic women have the best chance of a long marriage.
Australian Divorce Rate over the past 100 years
I was struck by the parallel pattern of the US divorce rate and Australian divorce rate over the past 100 years. In both countries the rate was increasing slightly before World War II (1940-45), then increases sharply for a few years following the war, and finally spikes in the late 1970s before declining for the past 30 years.
These patterns suggest that the factors that were driving the divorce rate were present in at least two countries.
US Divorce Rates Compared to Western Countries
 Although the divorce rate has been declining in the United States, it is still higher than many of the other Western countries.
See original source at the U.S. Census Bureau.
More Demographic information here….