Professor Philip Cohen (blogger of Family Inequality) provides a short description of how divorce rates vary by ethnicity, age, education and length of time married. A good reminder that the “average” divorce rate doesn’t tell us much about the risk to specific individuals. (just over 1 minute long).
Demographics
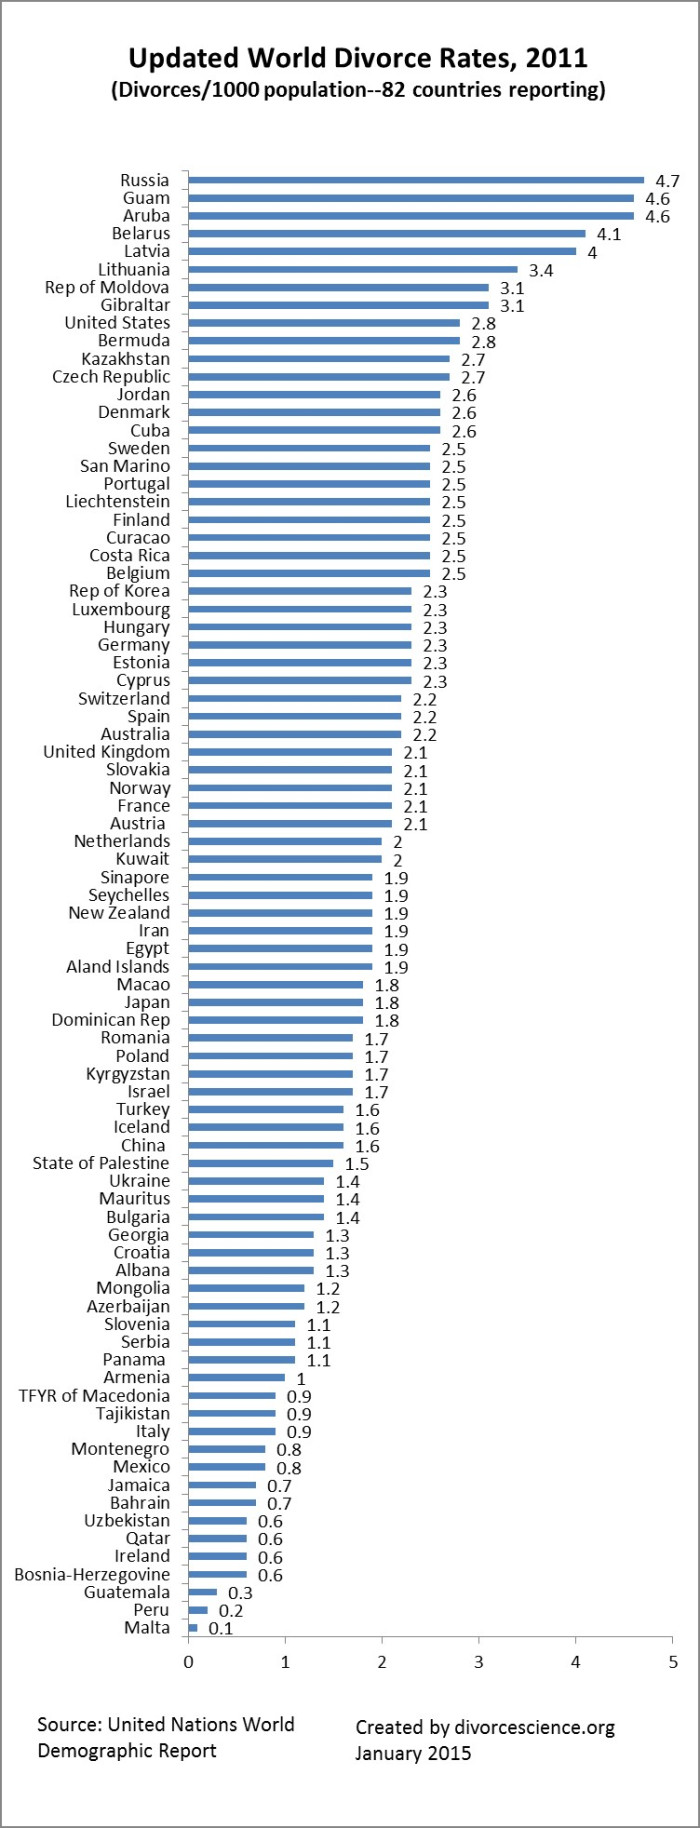
2011 Updated World Divorce Rates — 82 countries reporting
In January 2015, I updated the 2011 World Divorce Rate data and created this figure to illustrate the overall divorce rates. This represents the most current data across the world that is consistently reported to the United Nations. Many countries that have not yet reported 2012 or 2013 data such as the United States and Great Britain are included in this figure. Also, there are 70 countries that have reported their 2012 divorce rates and 11 countries that have reported 2013 data. The original data can be found in the United Nations Demographic Yearbook.
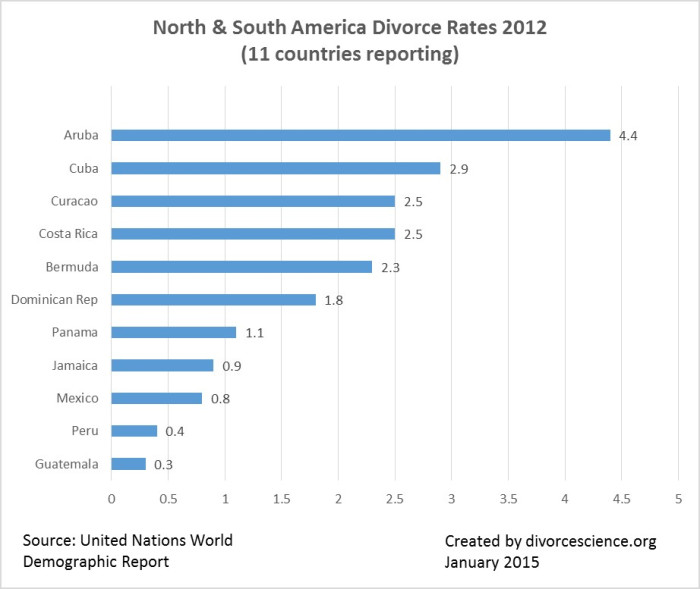
2012 North & South America Divorce Rates Updated
Eleven North and South American countries have reported divorce rates to the United Nations. Aruba has the highest divorce rate and Guatemala had the lowest divorce rate.
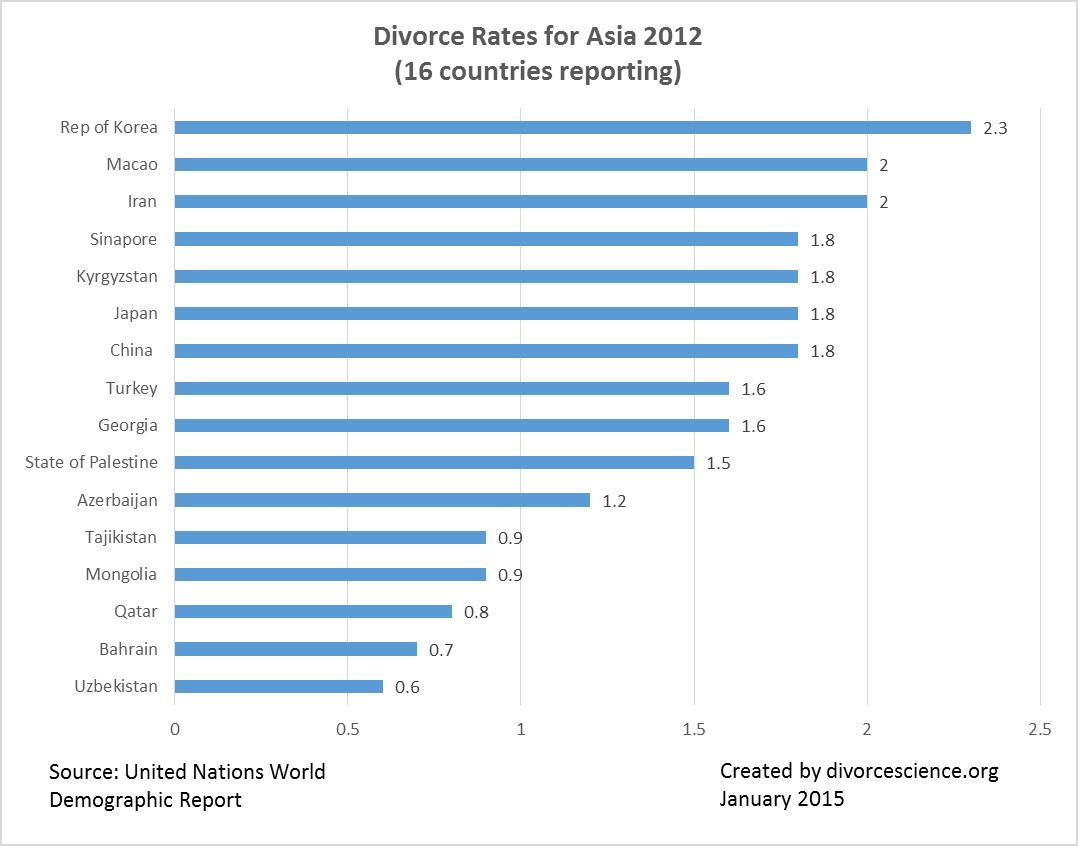
2012 Updated Asia Divorce Rates– 16 countries reporting
Asian countries have recently reported their 2012 divorce rates. Sixteen countries have reported. The Republic of Korea has the highest divorce rate and Uzbekistan has the lowest of the countries reporting.
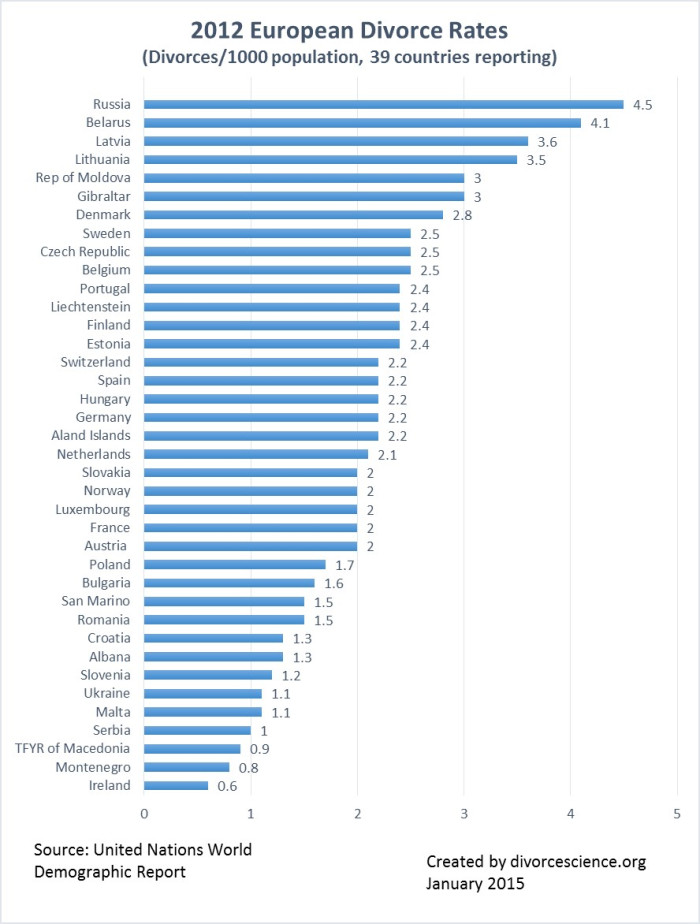
2012 Updated European Divorce Rates– 39 countries reporting
Thirty-nine European countries have reported their divorce rates to the United Nations. Russia continues to have the highest divorce rate. Ireland has the lowest divorce rate.
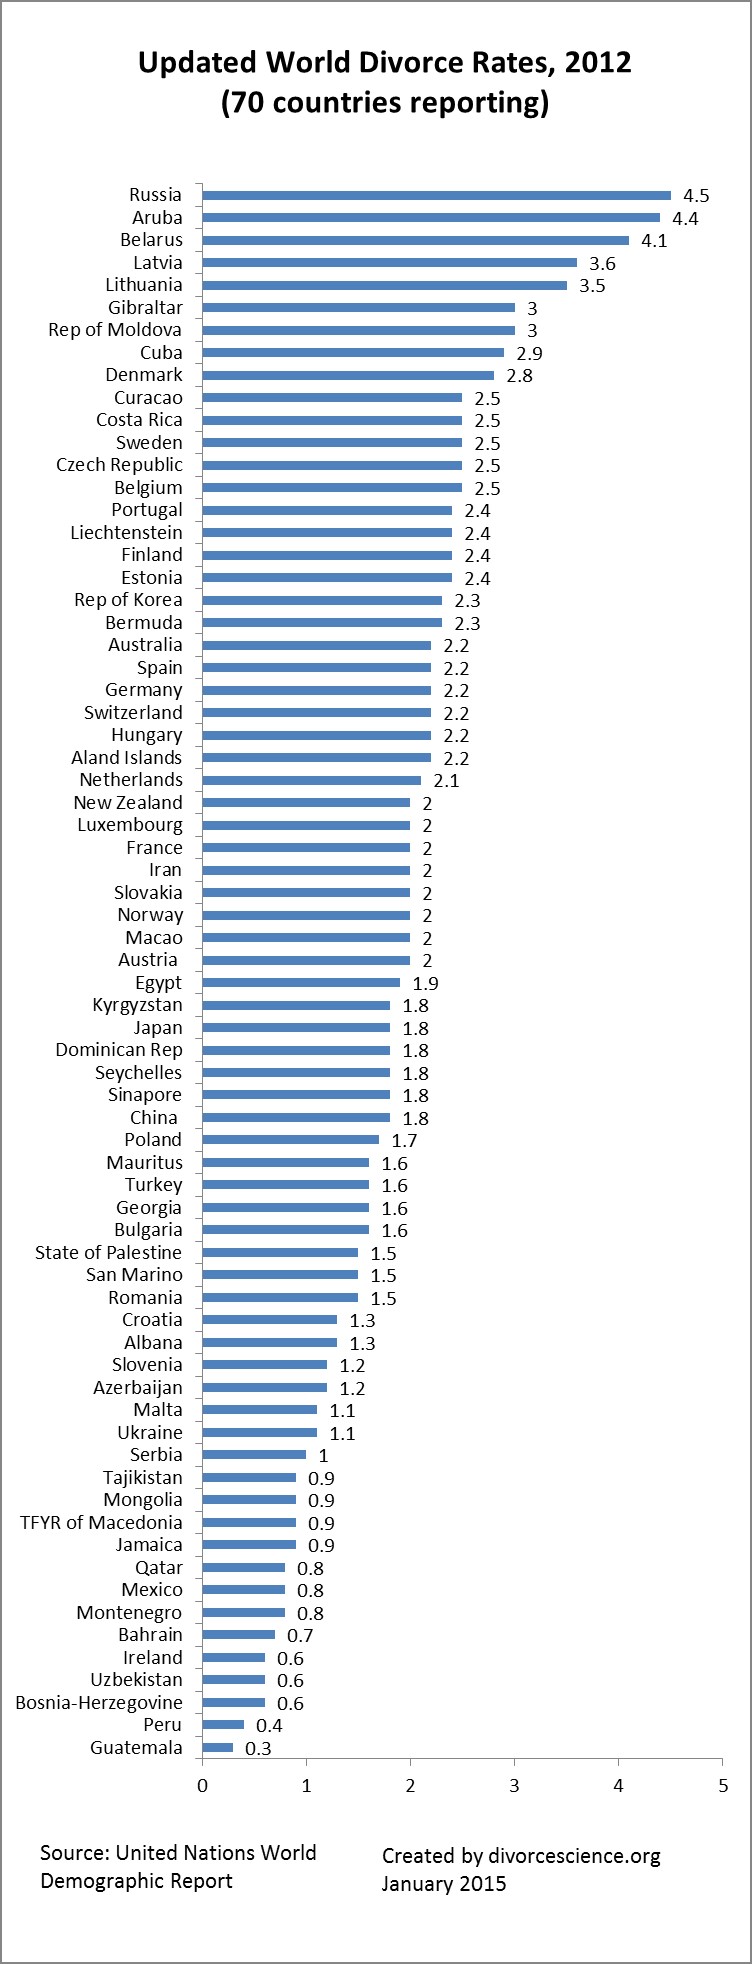
2012 Updated World Divorce Rates– 70 countries reporting
The United Nations released its most up to date report on marriages and divorce across the world. Seventy countries have now reported data. More postings about world divorce rates. There are 11 countries that have reported their 2013 divorce rates.
2013 Selected World Divorce Rates
The United Nations has released the latest divorce rate information. At present very few countries are included. For most of these countries there has been little change in the divorce rate since 2012. The original data are here. Also see the 2012 World Divorce Rates.