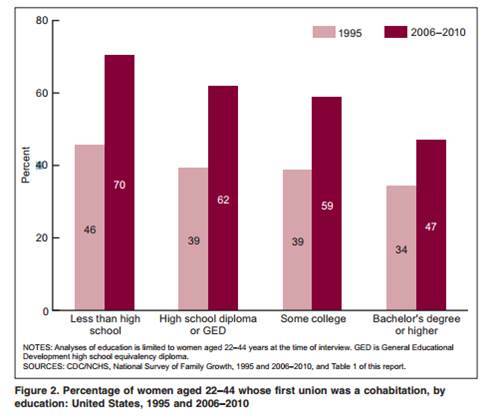
The most striking recent findings in regards to patterns of marriage is the variations in cohabitation by the educational level of women. This chart comparing women with less than a high school degree with those women who earn a Bachelor degree is telling. In 1995 46% of women with less than a high school degree started a first union as cohabitation. In 2010 that percentage is now 70%. For women with a Bachelor’s degree, cohabitation is more common, but only 47% of these women are starting their first union as cohabitation. The more education that women have, the less likely they are to begin their first union as cohabitation. The complete report on cohabitation trends is available from the National Center for Health Statistics.